2nd Jul 2024. 9.58pm

Regency View:
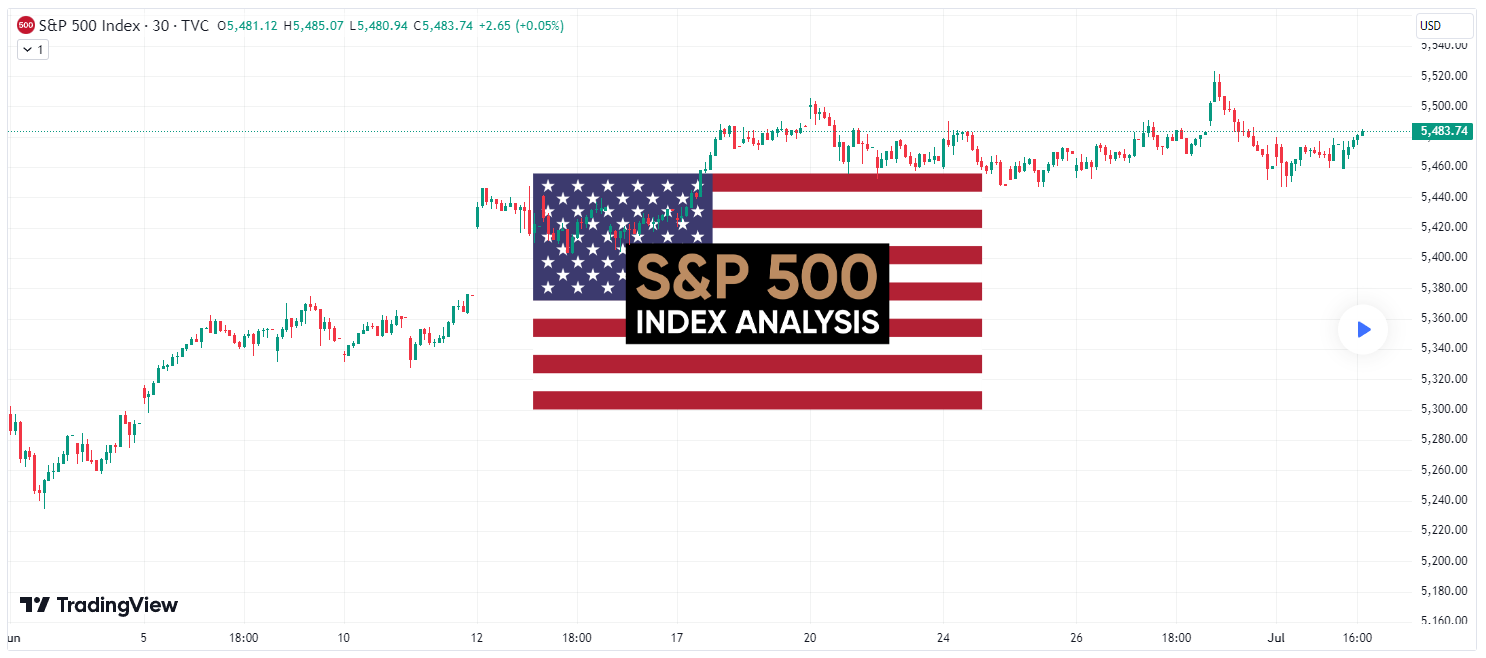
S&P 500 Reversal Signals Potential Pullback
S&P Index Analysis
Last week, the S&P 500’s attempt to break out to new highs ended in a dramatic reversal, forming a bearish engulfing pin-bar candle. This key technical pattern, alongside a negative RSI divergence, signals waning bullish momentum and raises the probability of a market pullback.
Failed Breakout and Bearish Indicators:
On Friday, the S&P 500 attempted to break out of this consolidation phase, aiming for new trend highs. Such a breakout typically signals renewed bullish momentum and can attract more buying interest. However, the breakout attempt was unsuccessful. Instead of closing at a new high, the index reversed its course intraday and ended the week near its five-day lows.
Formation of a Bearish Engulfing Pin-Bar Candle:
This price action resulted in the formation of a bearish engulfing pin-bar candle on the chart, a hybrid pattern combining elements of both the bearish engulfing and pin-bar reversal patterns:
1. Bearish Engulfing Pattern:
• A bearish engulfing pattern occurs when a larger bearish candle engulfs the body of the preceding smaller bullish candle. This indicates a significant shift in market sentiment, where sellers have gained control after a period of buying pressure.
• In this case, the bearish engulfing pattern underscores the failure of the breakout attempt and highlights increasing selling pressure.
2. Pin-Bar Reversal Pattern:
• A pin-bar pattern features a long tail (or wick) and a small body, indicating a sharp reversal during the trading session. The long tail shows that prices were pushed to a new extreme (high or low) but were then rejected.
• The pin-bar’s long upper shadow in this scenario indicates that although buyers pushed prices higher initially, they were ultimately overpowered by sellers, leading to a close near the session’s low.
Negative Divergence on the RSI Indicator:
• Adding to these bearish signals, a negative divergence was observed on the Relative Strength Index (RSI) indicator. Negative divergence occurs when the market reaches higher highs, but the RSI indicator forms lower highs. This suggests that while the price is still moving upwards, the underlying momentum is weakening.
Implications of the Hybrid Pattern and RSI Divergence:
The combination of the bearish engulfing pin-bar candle and the negative RSI divergence is a strong technical signal suggesting potential further downside. This hybrid pattern and indicator divergence indicate:
• Rejection of Higher Prices: The initial bullish attempt was firmly rejected, demonstrating that the higher price levels were unsustainable.
• Shift in Market Sentiment: The combination of the engulfing and pin-bar characteristics points to a significant change in sentiment from bullish to bearish.
• Weakening Momentum: The RSI divergence highlights that the momentum behind the upward price movement is diminishing, increasing the likelihood of a price reversal.
SPX Daily Candle Chart
Disclaimer:
This research is prepared for general information only and should not be construed as any form of investment advice.